By:
HuaxinVending 2026-11-11Ice Cream Vending Machine Profit Calculator: Daily Cups and Break-Even Sales
Use this ice cream vending machine break even calculator to find the daily cups needed to cover costs, with formulas, scenarios, downtime and payback
How many cups does an ice cream vending machine have to sell each day before it stops losing money? An ice cream vending machine break even calculator answers that with one division: the costs that arrive every month whether or not anyone buys, divided by what each cup leaves behind after its own costs. In the worked example in this article, a machine selling at $5.50 a cup in a US shopping mall needs about 13 cups a day to cover its running costs. Change the rent, the price or the payment terms and that figure moves, in some cases by 40% or more.
That number answers only one question, though. Covering monthly costs, keeping enough cash in the account and earning back the money spent on the machine are three separate tests, and a location can pass the first while failing the other two. This guide works through each input, shows the formulas behind the calculator on this page and runs the numbers for weak, average and strong locations, for operators and investors in the United States, Europe, Australia and the Middle East. Every figure in the worked examples is an assumption chosen to show the method, not a forecast; replace them with your own quotes in the calculator before making a decision.
1 Why break-even daily cups come before a revenue forecast
Sales forecasts for a new location are guesses, and usually hopeful ones. The costs of running a machine there, by contrast, are mostly known before anything is signed: the venue quotes the rent, the mix supplier quotes a price per refill, the payment provider publishes its fees. Break-even analysis turns the question around. Instead of asking how much a site will sell, it asks how much the site must sell, and that figure can be tested against what the venue knows about its own traffic.Cups are easier to test than dollars. A venue manager may not know what visitors spend, but most can give a footfall count. If a corridor carries 3,000 people a day, 13 cups is fewer than one passer-by in 200. If it carries 600, the same 13 cups means more than one in 50, which is a much harder ask. Neither ratio is a benchmark; it simply shows how much work the location has to do.
Keep three measures apart from the start:
| Measure | Question it answers | What goes into it |
| Operating break-even | How many cups cover this month’s running costs? | Net price, variable cost per cup, monthly fixed costs |
| Cash flow | Will the bank balance stay positive month by month? | Timing of stock purchases, deposits, card settlements, tax payments and seasonal dips |
| Payback period | How long until operating profit returns the money spent to start? | Total initial investment divided by monthly operating profit |
2 Equipment investment and operating costs are different money
The investment is everything spent once to get a working machine on site: the machine in its ordered configuration, freight and insurance, import duty and brokerage, delivery into the venue, any electrical work, the first stock of mix, cups and toppings, a spare parts kit and the site deposit. Our startup budget guide sets these out line by line. None of them belongs in the daily break-even formula. They are recovered over time from operating profit, which is what the payback period measures.Operating costs recur, and they split into two kinds. Variable costs rise with every cup sold: mix, the cup itself, toppings, the payment fee and any revenue share. Fixed costs arrive each month regardless of sales: rent, scheduled labor, connectivity, insurance and a maintenance reserve.
A few costs sit between the two, and simple models often get them wrong:
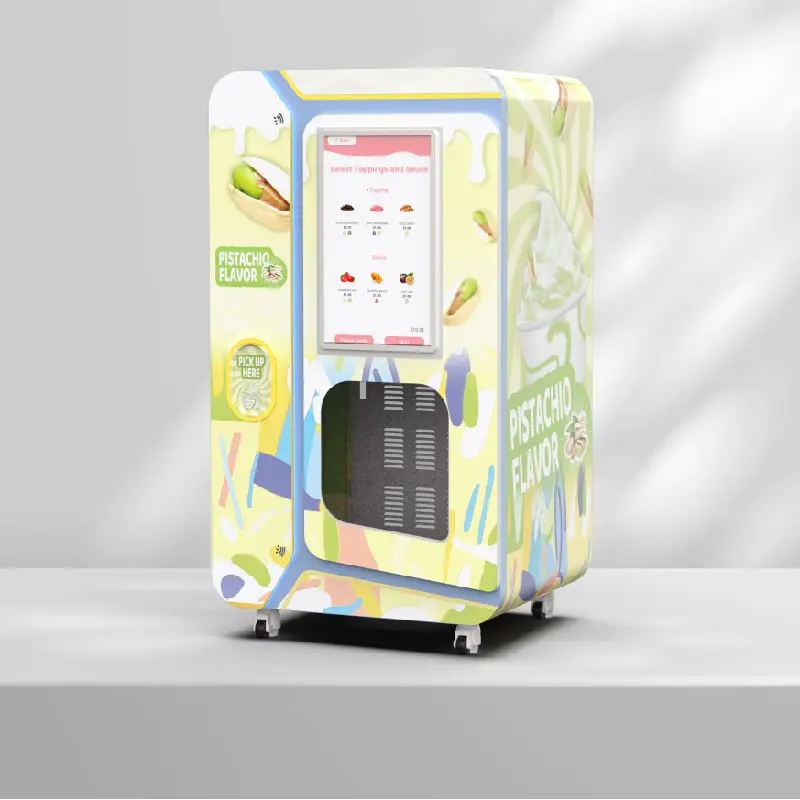
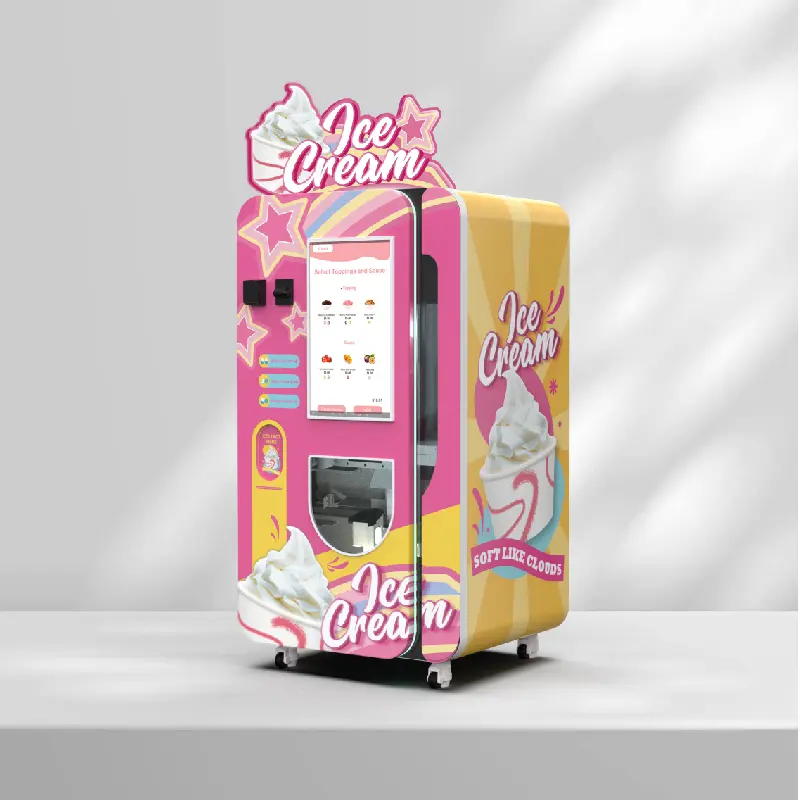
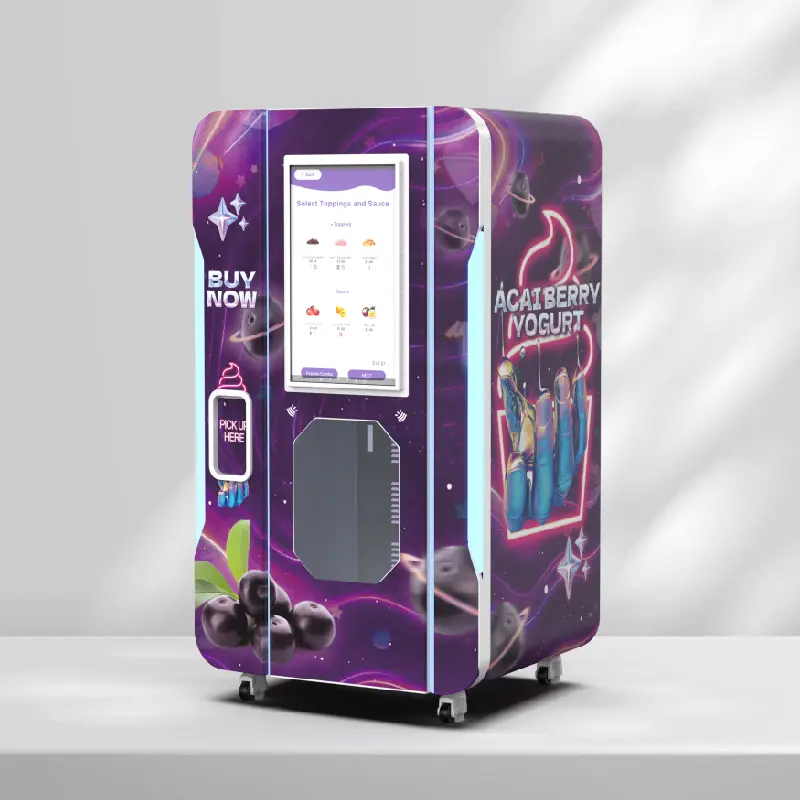
- Labor steps up with volume. On Huaxin’s floor-standing B-series machines, the standard capacity version gives about 80 servings per mix refill and the enhanced version about 160 to 180, while the cup magazine holds about 160 cups. Whichever runs out first sets the visit schedule, and the visit schedule sets labor cost. Plan visits around the busiest day of the week, not the average day.
- Machine finance is not an operating cost. A loan or lease payment is a monthly cash outflow, but it pays for the investment. Either keep it in the payback calculation or add it deliberately as a capital recovery line, as the calculator allows.
- Production speed is rarely the limit. At 15 to 20 seconds per cup, a B-series machine serves three to four customers a minute when there is a queue. Break-even is decided by demand and by how often the machine is refilled, not by how fast it works.
3 Selling price and variable costs per cup
Start from the price you keep
The price on the screen is often not the price the business keeps. Where sales tax, VAT or GST is included in the displayed price, divide by one plus the tax rate before doing anything else. Skipping this step overstates the margin on every cup by the full amount of the tax.| Market | Tax on the sale | Example: displayed price to net price |
| United Kingdom | VAT at 20%; HMRC lists ice cream as standard-rated | £4.50 → £3.75 |
| European Union | VAT; standard rates run from 17% to 27% by member state, and reduced food rates vary | €5.00 at 21% → €4.13 |
| Australia | GST at 10%; the ATO lists ice cream as taxable food | A$7.00 → A$6.36 |
| United Arab Emirates | VAT at 5% | AED 20.00 → AED 19.05 |
| Saudi Arabia | VAT at 15% | SAR 20.00 → SAR 17.39 |
| United States | State and local sales tax; treatment of food and vending sales varies | Decide whether the screen price includes tax |
Cost every cup the way it is actually sold
Ice cream mix. The most reliable figure comes from the machine itself: divide the cost of one full refill by the number of cups it actually produced. Label yields assume a portion size and an overrun, which the University of Guelph’s ice cream technology course defines as the percentage increase in volume over the mix used. A larger portion, or a mix that takes in less air, raises the cost per cup even when the price per bag has not changed.Cup, lid and spoon. The landed cost per unit, including delivery.
Toppings and sauces. A B-series machine combines one ice cream base with up to three dry toppings and three sauces. Cost the average order rather than the cheapest one; if most customers add two toppings, cost two.
Payment fees. Most providers charge a percentage of the amount the customer pays, tax included, plus a fixed amount per transaction, and on a small ticket the fixed part weighs heavily. In the United States, Stripe lists 2.7% plus 5 cents for in-person card payments through its Terminal product. Vending-specific plans are often priced differently: one US reseller lists Nayax plans at a blended 5.95% for vends of $5 or less, or 2.5% plus 10 cents above $5. On a $5.50 cup that is 33 cents against 24 cents, a gap worth about 9 cents on every sale. Which structure is available depends on the terminal fitted and the provider in your market; the payment system guide covers what to agree with both. Monthly device fees belong under fixed costs.
Revenue share. If the venue takes a percentage of sales instead of, or on top of, a fixed rent, that percentage is a variable cost on the net price.
Waste and refunds. Mix is discarded during cleaning and changeovers, a test serve follows each restart, product passes its use-by date and the occasional failed vend is refunded. The cleaning guide explains where those losses arise. Start with a placeholder allowance and replace it with measured figures after the first month.
Hypothetical example — for illustration only.
| Item | Per cup (USD) | Basis |
| Net selling price | 5.50 | Excluding sales tax |
| Ice cream mix | 0.80 | Refill cost divided by cups produced |
| Cup, lid and spoon | 0.15 | Landed case price divided by units |
| Toppings and sauces | 0.35 | Average across the menu |
| Payment fee | 0.24 | 2.5% plus $0.10 |
| Waste and refunds allowance | 0.10 | Placeholder until measured |
| Total variable cost | 1.64 | |
| Contribution per cup | 3.86 | Net price minus variable cost, about 70% of the price |
4 Fixed monthly costs: rent, labor, connectivity and maintenance
Location rent. Venues charge a fixed monthly fee, a share of sales, or a minimum guarantee plus a share. A busy mall corridor costs more than a campus building, and the rent usually follows the footfall the venue can prove.Labor. Count every scheduled visit for refilling, wiping down, checking the cleaning cycle and clearing the pickup area, including travel time. Count your own time at a market rate even if you do the work yourself. Otherwise the model looks better than the business really is, and the numbers change the day you hire someone.
Connectivity and software. Data plan, payment device fees and any remote platform charges.
Electricity. Relevant where the venue meters the machine separately; many include power in the rent. Ask the supplier for measured daily consumption at a stated room temperature, or fit a plug-in meter for a week, then multiply by your tariff. For scale, the US Energy Information Administration put the 2025 average retail price for commercial customers at about 13.4 cents per kilowatt-hour, with wide variation between states.
Insurance and permits. Liability cover, a food business registration or permit where required, and venue-mandated insurance, converted to a monthly figure.
Maintenance reserve. Filters, seals, wear parts and cleaning supplies. Huaxin’s published warranty covers the whole machine for one year, with replacement parts and repair services included, so in the first year the reserve mainly covers consumables and wear items. Keep building it anyway; it pays for the years after.
Hypothetical example — for illustration only.
| Fixed cost | USD per month | Assumption |
| Location rent | 800 | Fixed fee for a mall corridor position |
| Labor | 480 | 30 visits of 40 minutes at $24 an hour |
| Electricity | 60 | Placeholder; about 15 kWh a day at 13.4 cents |
| Connectivity and payment device fees | 30 | SIM data plus device service fee |
| Insurance and permits | 40 | Annual costs divided by 12 |
| Maintenance reserve | 60 | Wear parts and cleaning supplies |
| Total fixed costs | 1,470 |
5 The break-even formula for daily cups
Three lines do the work:Contribution per cup = net price − variable cost per cup
Break-even cups per month = monthly fixed costs ÷ contribution per cup
Break-even cups per selling day = break-even cups per month ÷ selling days in the month
With the example figures, $1,470 ÷ $3.86 gives about 381 cups a month. Over 30 selling days that is 12.7 cups a day. If closures and downtime leave 27 selling days, the same month needs 14.1 cups on each of them. Use selling days, not calendar days.
When the venue takes a revenue share, apply it before subtracting variable costs: contribution per cup = net price × (1 − revenue share) − variable cost per cup.
Adding the investment: full-cost break-even
Operating break-even ignores the machine itself. To find the volume that also recovers the investment within a target period, add a capital recovery line to the fixed costs: investment ÷ target months. Assume a total investment of $15,000, a figure within the one-machine range in our startup budget guide. Recovering it over 24 months adds $625 a month, which raises the requirement to 542 cups a month, or 18.1 a day. Over 36 months it is 16.3 a day. These figures are before income tax and financing costs.Payback period itself is the same arithmetic run the other way: payback in months = total investment ÷ monthly operating profit, where monthly operating profit = cups sold × contribution per cup − fixed costs.
6 Sensitivity analysis: low, base and high sales volume
The same machine at three hypothetical locations, with every other assumption unchanged:Hypothetical example — for illustration only.
| Conservative | Base | Optimistic | |
| Cups per day | 15 | 30 | 60 |
| Cups per month (30 selling days) | 450 | 900 | 1,800 |
| Net sales | $2,475 | $4,950 | $9,900 |
| Contribution after variable costs | $1,738 | $3,476 | $6,953 |
| Fixed costs | $1,470 | $1,470 | $1,470 |
| Monthly operating profit | $268 | $2,006 | $5,483 |
| Payback on a $15,000 investment | About 56 months | About 7.5 months | About 2.7 months |
Price and fixed costs matter as much as volume. The table below shows break-even cups per day for combinations of the two, with the other example inputs held constant:
Hypothetical example — for illustration only.
| Monthly fixed costs | Net price $4.50 | Net price $5.50 | Net price $6.50 |
| $1,000 | 11.5 | 8.6 | 6.9 |
| $1,500 | 17.3 | 12.9 | 10.3 |
| $2,500 | 28.9 | 21.6 | 17.2 |
Fixed rent or revenue share?
Suppose the venue offers a 15% share of net sales in place of the $800 rent. Contribution per cup falls from $3.86 to $3.04, but fixed costs fall to $670, and break-even drops from 12.7 to 7.4 cups a day. The two arrangements cost the same at about 32 cups a day. Below that, the revenue share leaves more profit: about $429 more a month at 15 cups a day. Above it, fixed rent wins: about $685 more a month at 60 cups a day. For an unproven site, a revenue share limits the downside; once a site has shown it sells well, a fixed rent keeps more of the upside.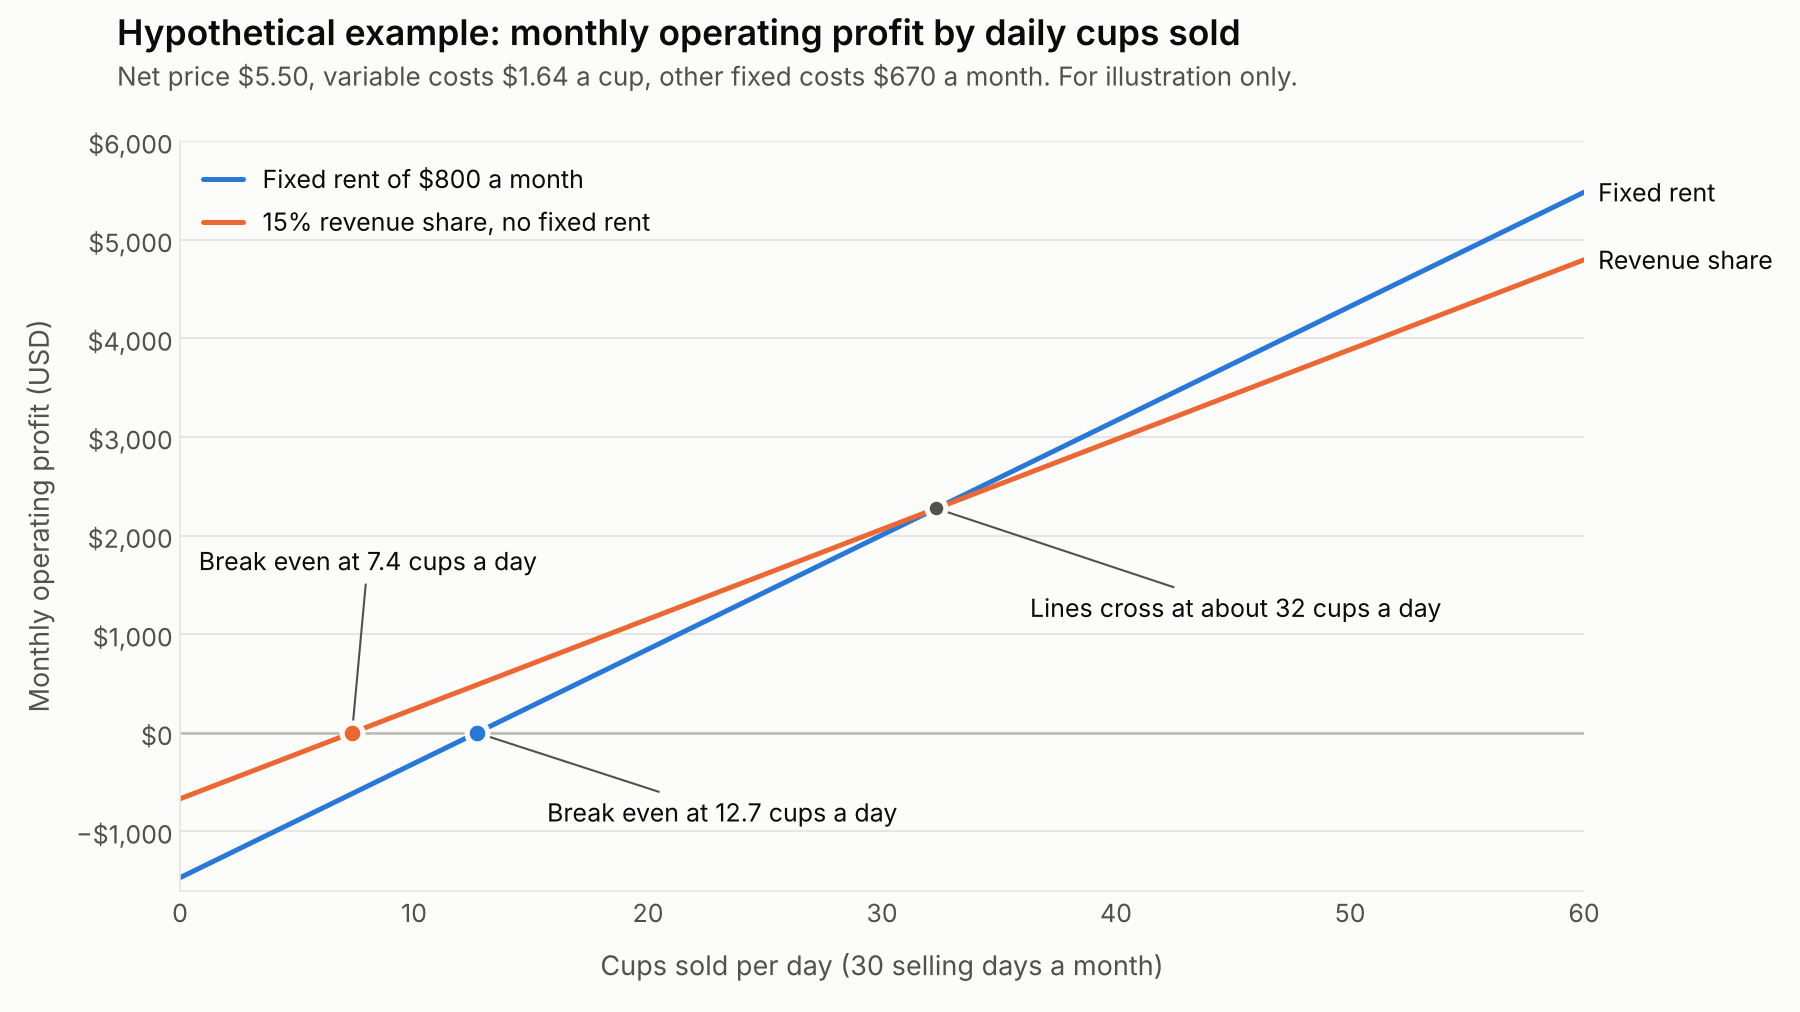
Hypothetical example. Net price $5.50, variable costs $1.64 a cup, other fixed costs $670 a month.
7 Downtime, seasonality and swings in daily sales
Downtime costs contribution, not just sales
When a machine stops, its fixed costs keep running. In the base scenario, three lost selling days in a month remove about $348 of contribution, roughly a sixth of the scenario’s normal monthly operating profit, before counting any mix discarded during the stop. The usual causes are avoidable ones: cups or mix running out before the next visit, a cleaning cycle left unfinished, a payment or network fault nobody saw, or a venue closure nobody planned for. Remote alerts shorten the time between a stop and a response, and the troubleshooting guide covers the first checks that bring a machine back. In the calculator, enter selling days after expected downtime, not calendar days.Annual averages hide losing months
Hypothetical example — for illustration only. Suppose a location sells 8 cups a day for five quiet months, 30 a day for four shoulder months and 55 a day for three peak months. Averaged over the year, that is about 27 cups a day, comfortably above the 12.7 needed. Yet each quiet month loses about $543, or about $2,715 across the five, while the year as a whole produces about $20,000 of operating profit. A machine that starts trading at the beginning of the quiet season has to fund that dip before the busy months arrive. Indoor venues with steady footfall flatten the curve; tourist sites tend to steepen it. Which months are busy depends on the venue and the climate rather than on the calendar, so ask the venue for footfall by month.Cash flow runs on a different clock
Operating break-even assumes costs and income land in the same month. In practice, mix and cups are bought by the case ahead of sales, card settlements arrive days later, insurance is often paid a year in advance and VAT or GST follows the tax authority’s schedule. Hold a reserve that covers fixed costs through the longest expected run of below-break-even months, plus one full restock. Daily swings matter as well: if weekends sell twice the weekday volume, plan refills for the weekend, or the busiest days end in a stock-out.8 How to use the ice cream vending machine break-even calculator
The calculator on this page runs the same formulas as sections 3 to 5. It works in your browser and does not store or send the figures you enter.- Price and tax. Enter the price shown on the screen and the tax rate, and tick the box if the price includes tax. The calculator derives the net price.
- Variable costs per cup. Mix, cup with lid and spoon, toppings and sauces, a waste allowance, the payment fee as a percentage plus a fixed amount, and any revenue share.
- Monthly fixed costs. Rent, labor, electricity, connectivity and device fees, insurance and permits, and a maintenance reserve.
- Selling days. The days the machine will actually trade after closures and expected downtime.
- Investment and sales estimate. Total investment, expected cups per day and, optionally, a recovery period for the full-cost break-even.
9 FAQ
How many cups a day does an ice cream vending machine need to sell to break even?Monthly fixed costs divided by contribution per cup, then by selling days. In this article’s hypothetical example that is about 13 cups a day; higher rent or a lower price can push it above 20.
What is the difference between break-even and payback?
Break-even is the volume at which monthly sales cover monthly running costs. Payback is how long the profit above that level takes to return the money spent on the machine, delivery and setup.
Should I include my own time as a cost?
Yes, at what you would pay someone else. A model that only works because the owner’s time is free does not hold up for a second or a tenth machine.
Is a revenue share better than a fixed rent?
A revenue share usually costs less at low volumes and a fixed rent leaves more profit at high volumes. Find the volume at which they cost the same, about 32 cups a day in this article’s example, and compare it with what the site is likely to sell.
How do VAT and GST affect break-even?
Tax collected on a sale is not income. Divide a tax-inclusive price by one plus the tax rate before calculating contribution per cup.
How accurate is a break-even calculation before the machine is installed?
The cost side can be accurate if it comes from written quotes. The sales estimate is the weak point, which is why many operators trial a location with one machine and use its first months of data before committing more machines or longer leases. 10 Check your numbers against a real machine configurationAn ice cream vending machine break even calculator is only as reliable as its inputs. The cost side can be fixed before you buy: net price after tax, a measured cost per cup, written rent terms and an honest labor figure. The sales side should be tested at the site, then corrected with real data once the machine is trading.
If you are evaluating a location, send Huaxin your country and city, the venue type, the rent or revenue-share terms on offer, your target price, your payment provider and the number of machines you plan to run, whether a single trial unit or a full 20-foot container of ten. We will send the configuration and refill capacity for a model such as the B85, the payment hardware available for your market and a quotation you can enter as the investment figure.

About the Author: Huaxin Company Pioneer of Smart Ice Cream Vending Machines, with 13 years of R&D and manufacturing expertise. Holds CE, RoHS, NSF, and ETL international certifications. Holds over 24 patents in China and commands a 70% market share.